Arina East Residences
, Kallang, Central · Freehold · Launched
Arina East Residences is a 107-unit freehold development of two 20-storey towers on Tanjong Rhu Road, a redevelopment of the former La Ville. It offers one- to four-bedroom units and is about a three-minute walk from Katong Park MRT station on the Thomson-East Coast Line.
- From
- S$1.43M
- Lowest
- S$2,876calculated
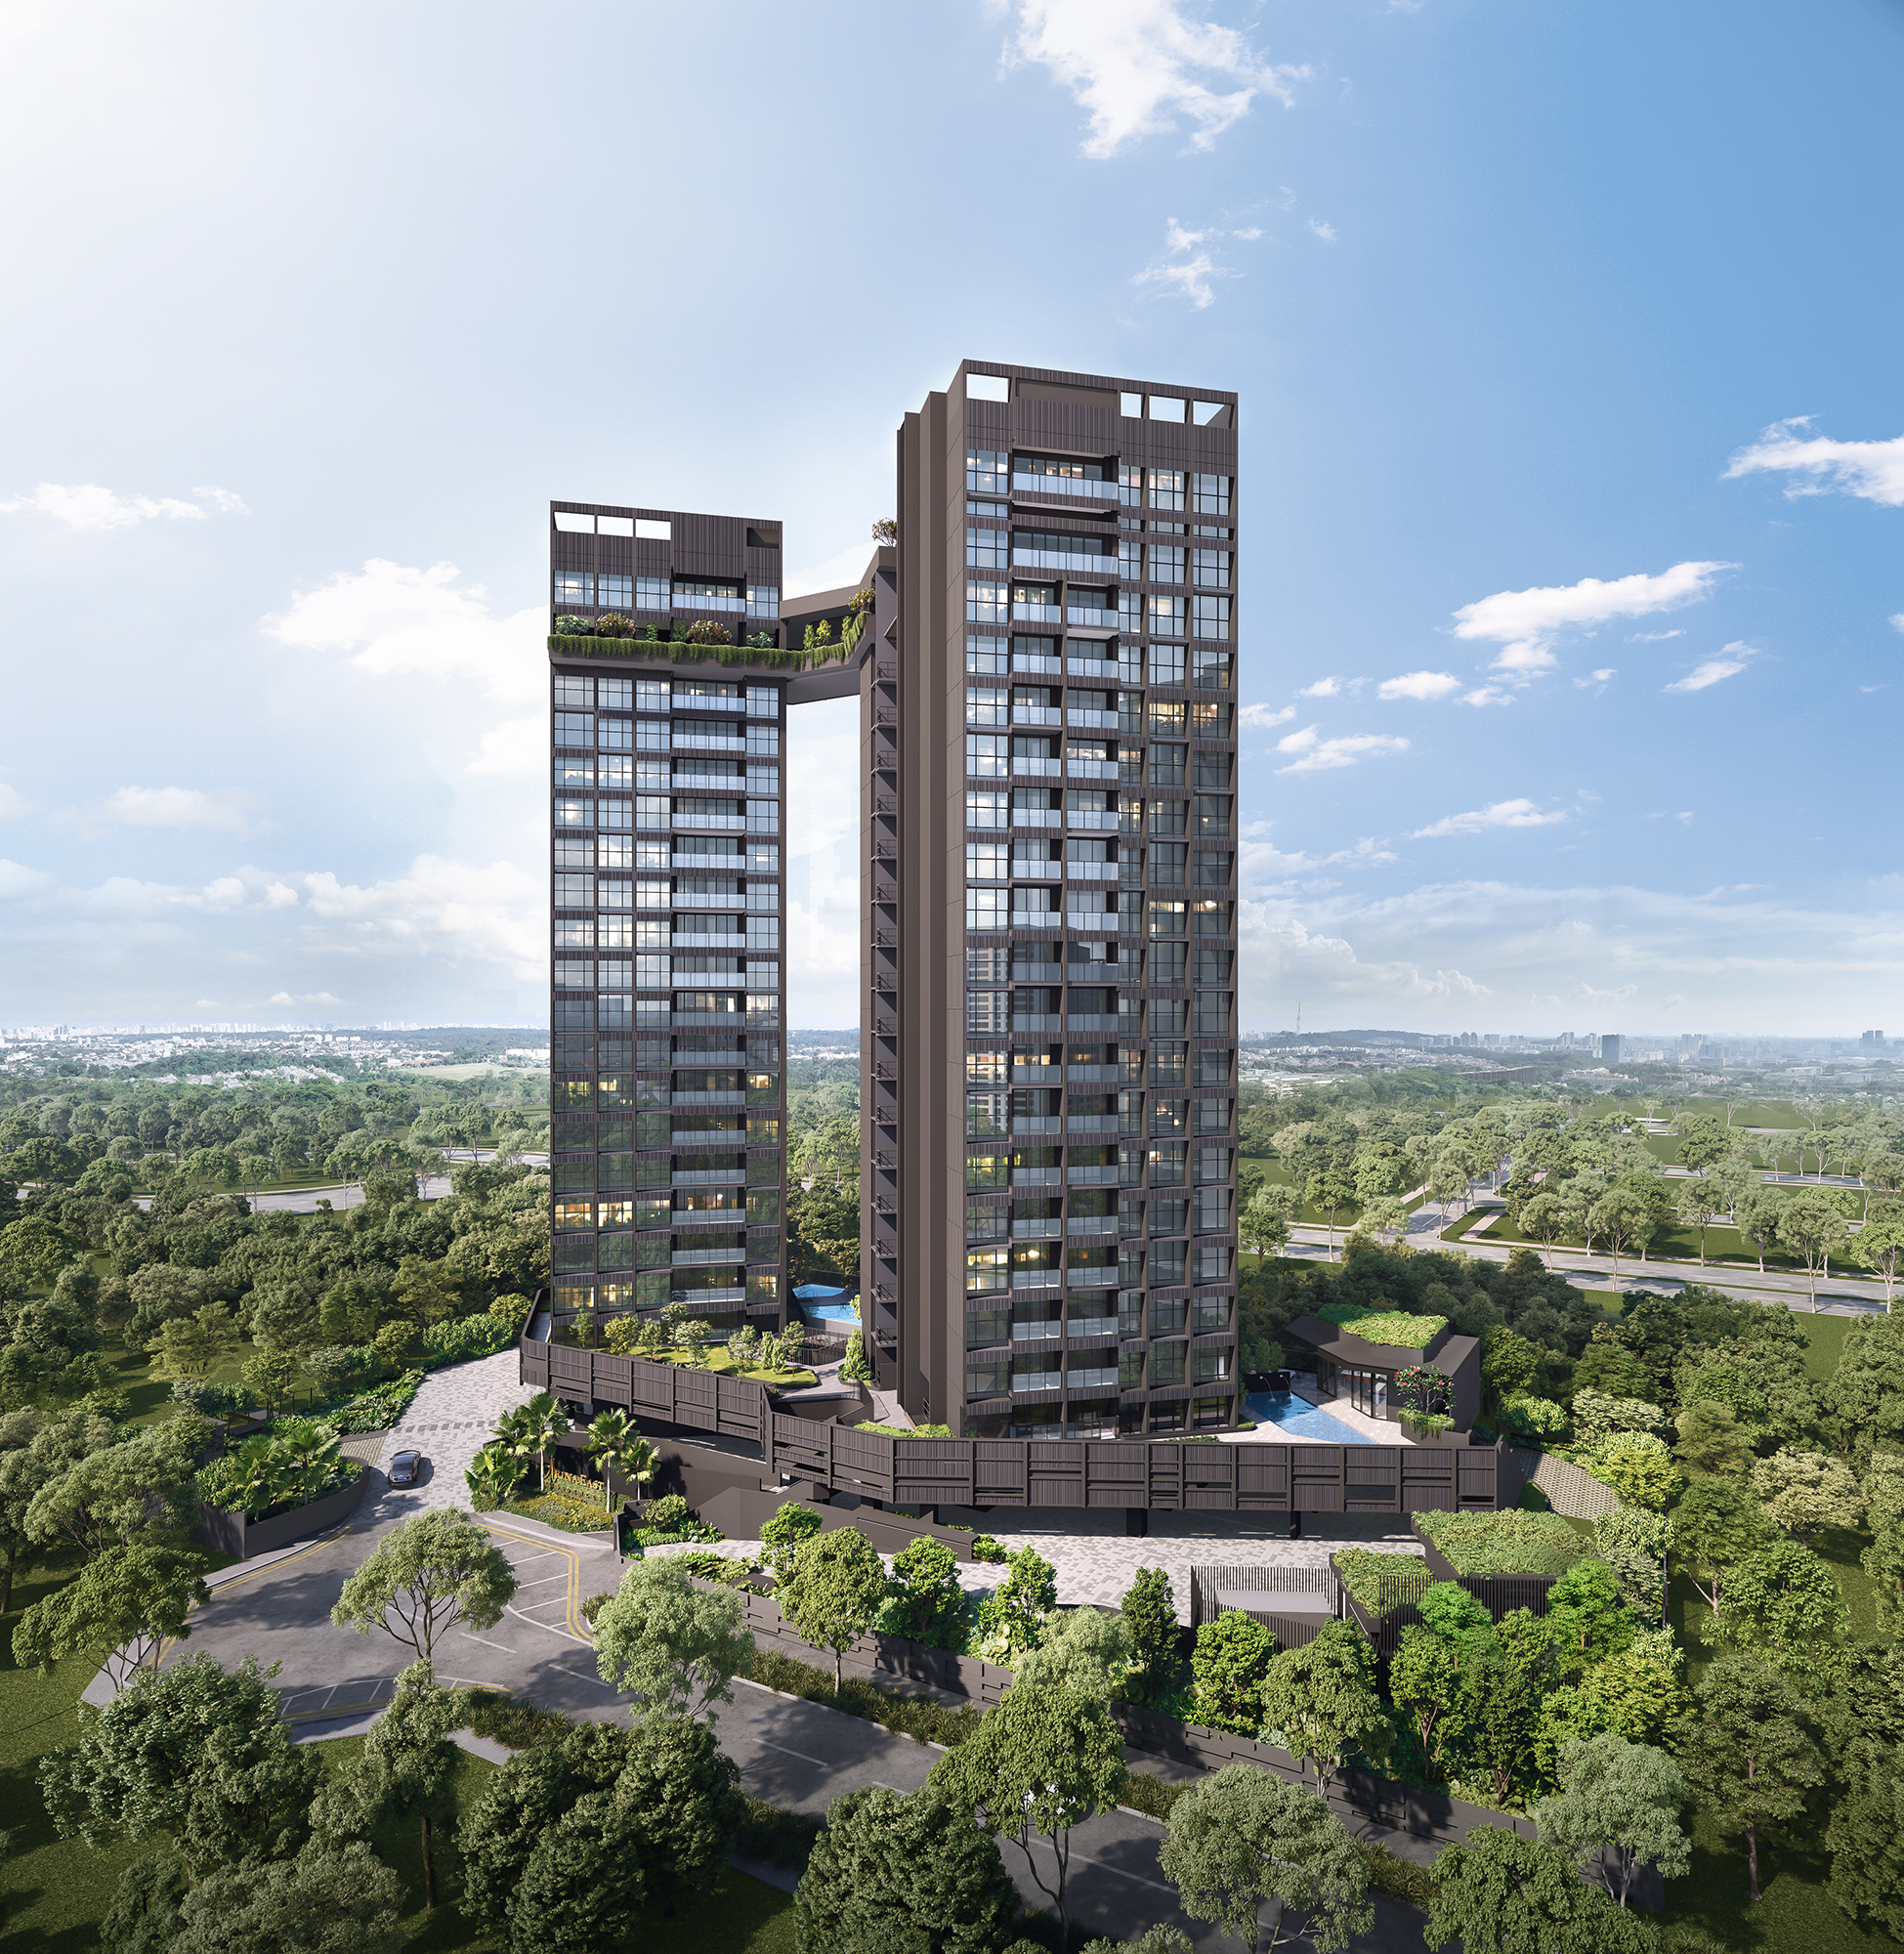
Exterior: Twin towers linked by a sky bridge, artist's impression. Arina East Residences project website (shows joint developers ZACD, FRX Capital, Welltech Construction) 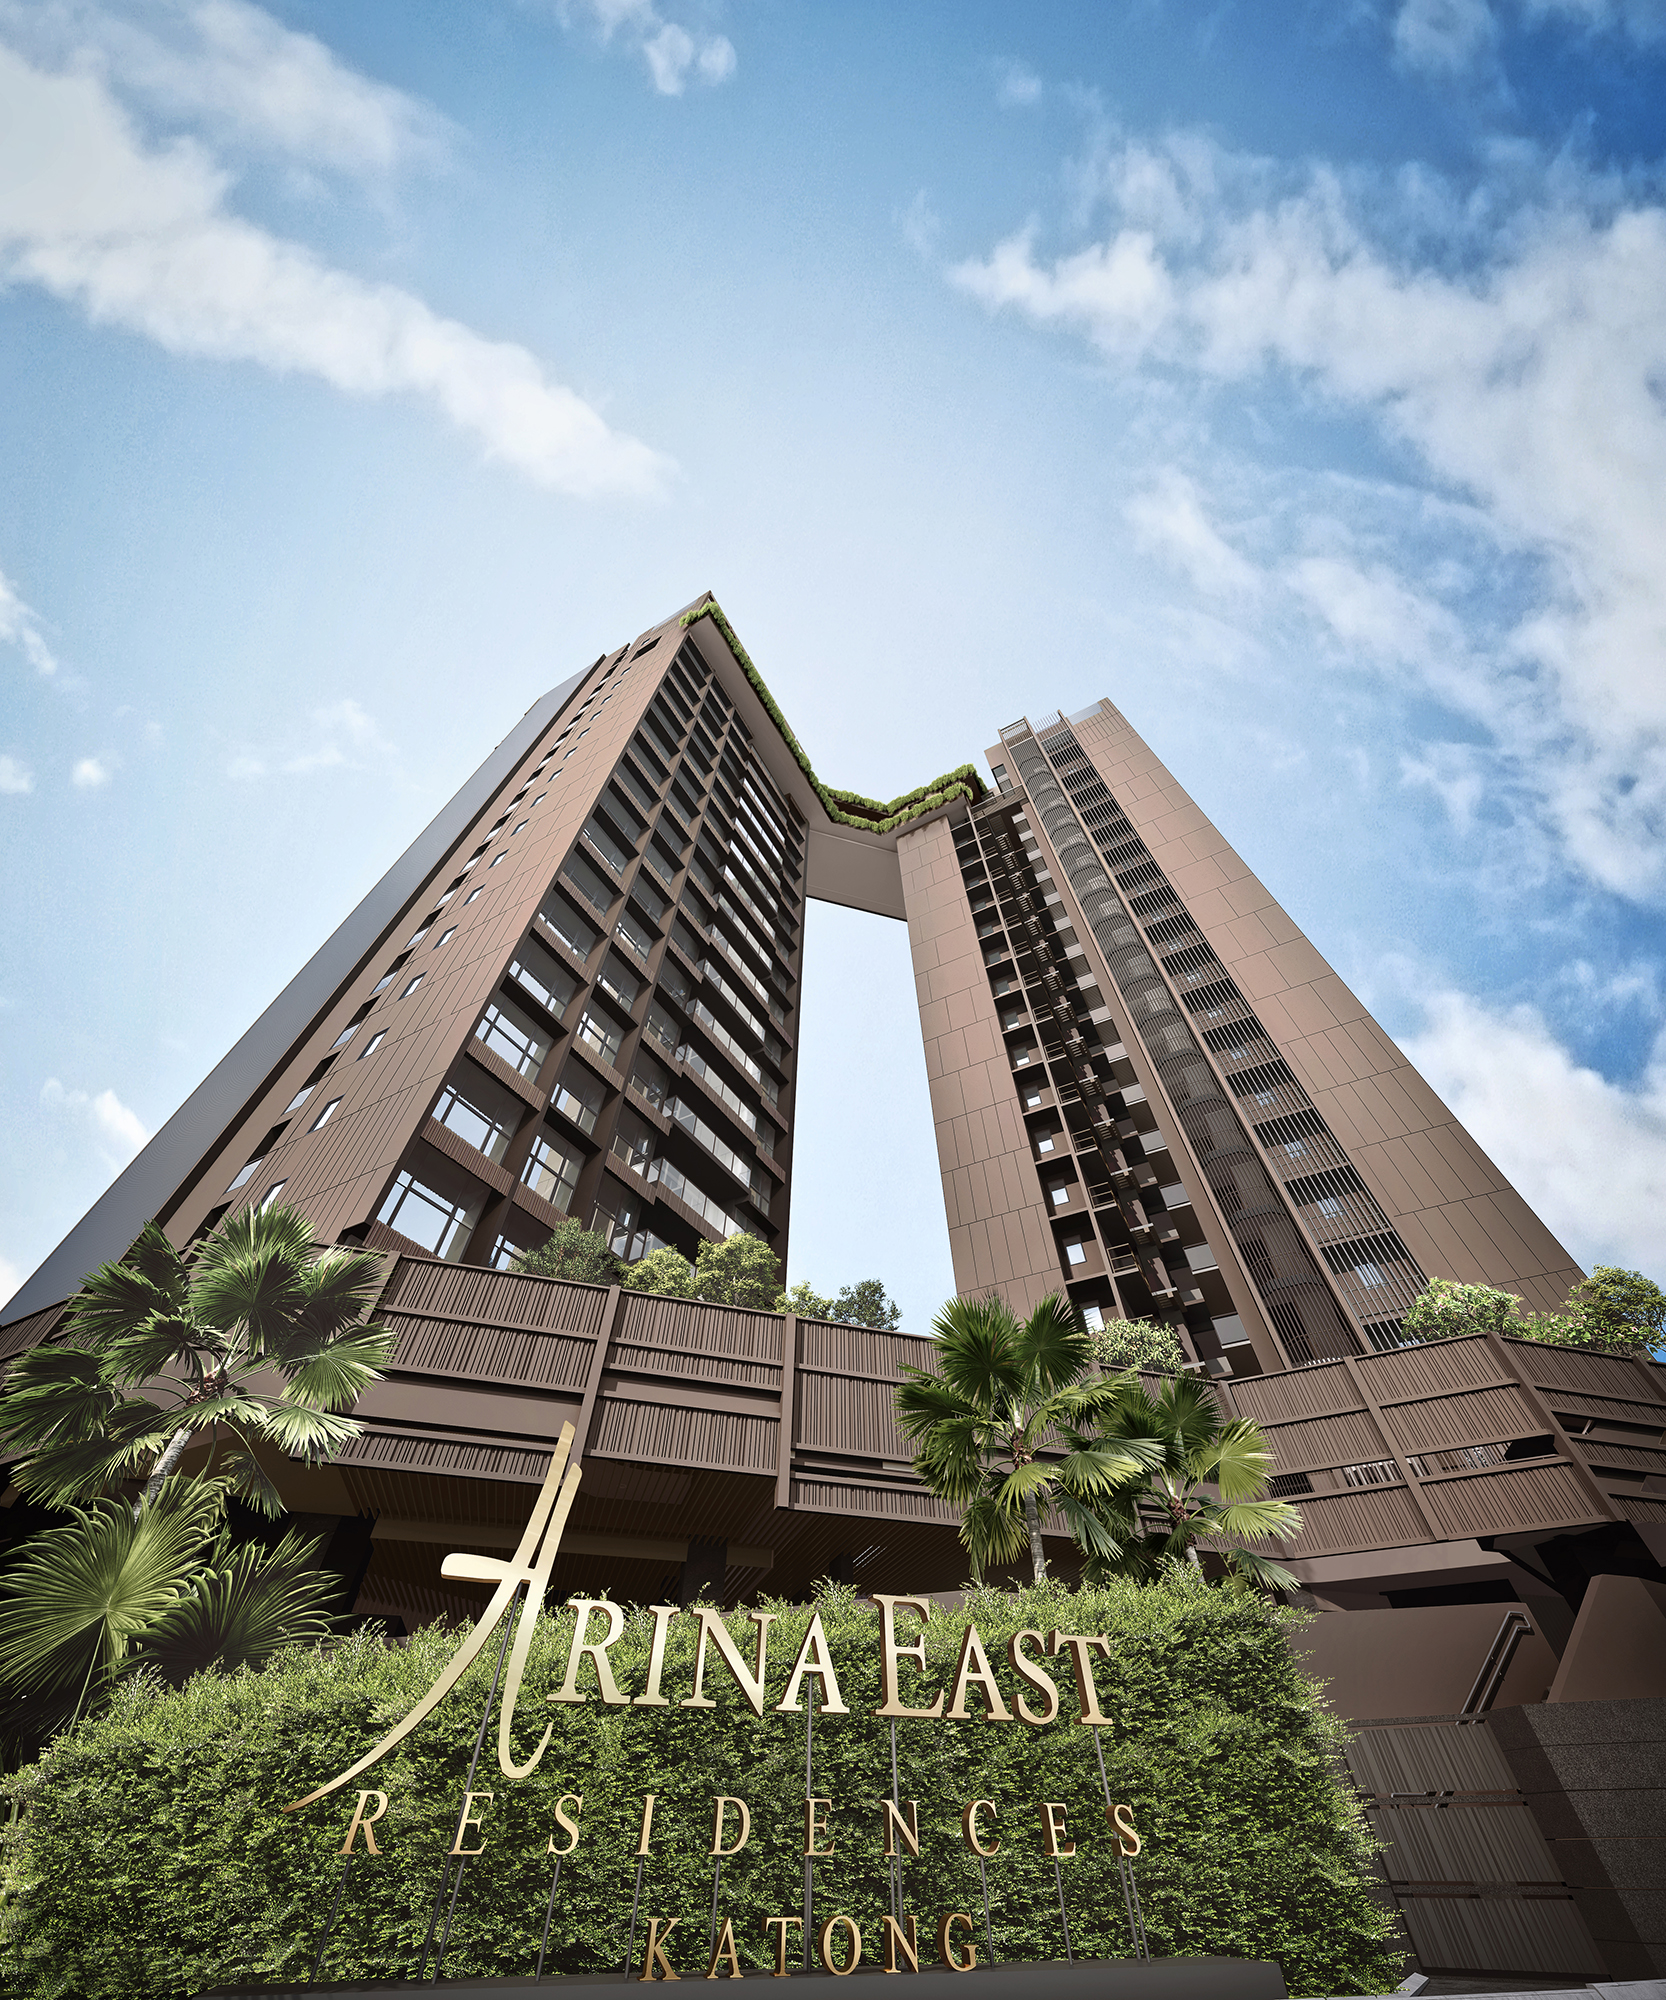
Exterior: Entrance and tower facade, artist's impression. Arina East Residences project website (shows joint developers ZACD, FRX Capital, Welltech Construction) 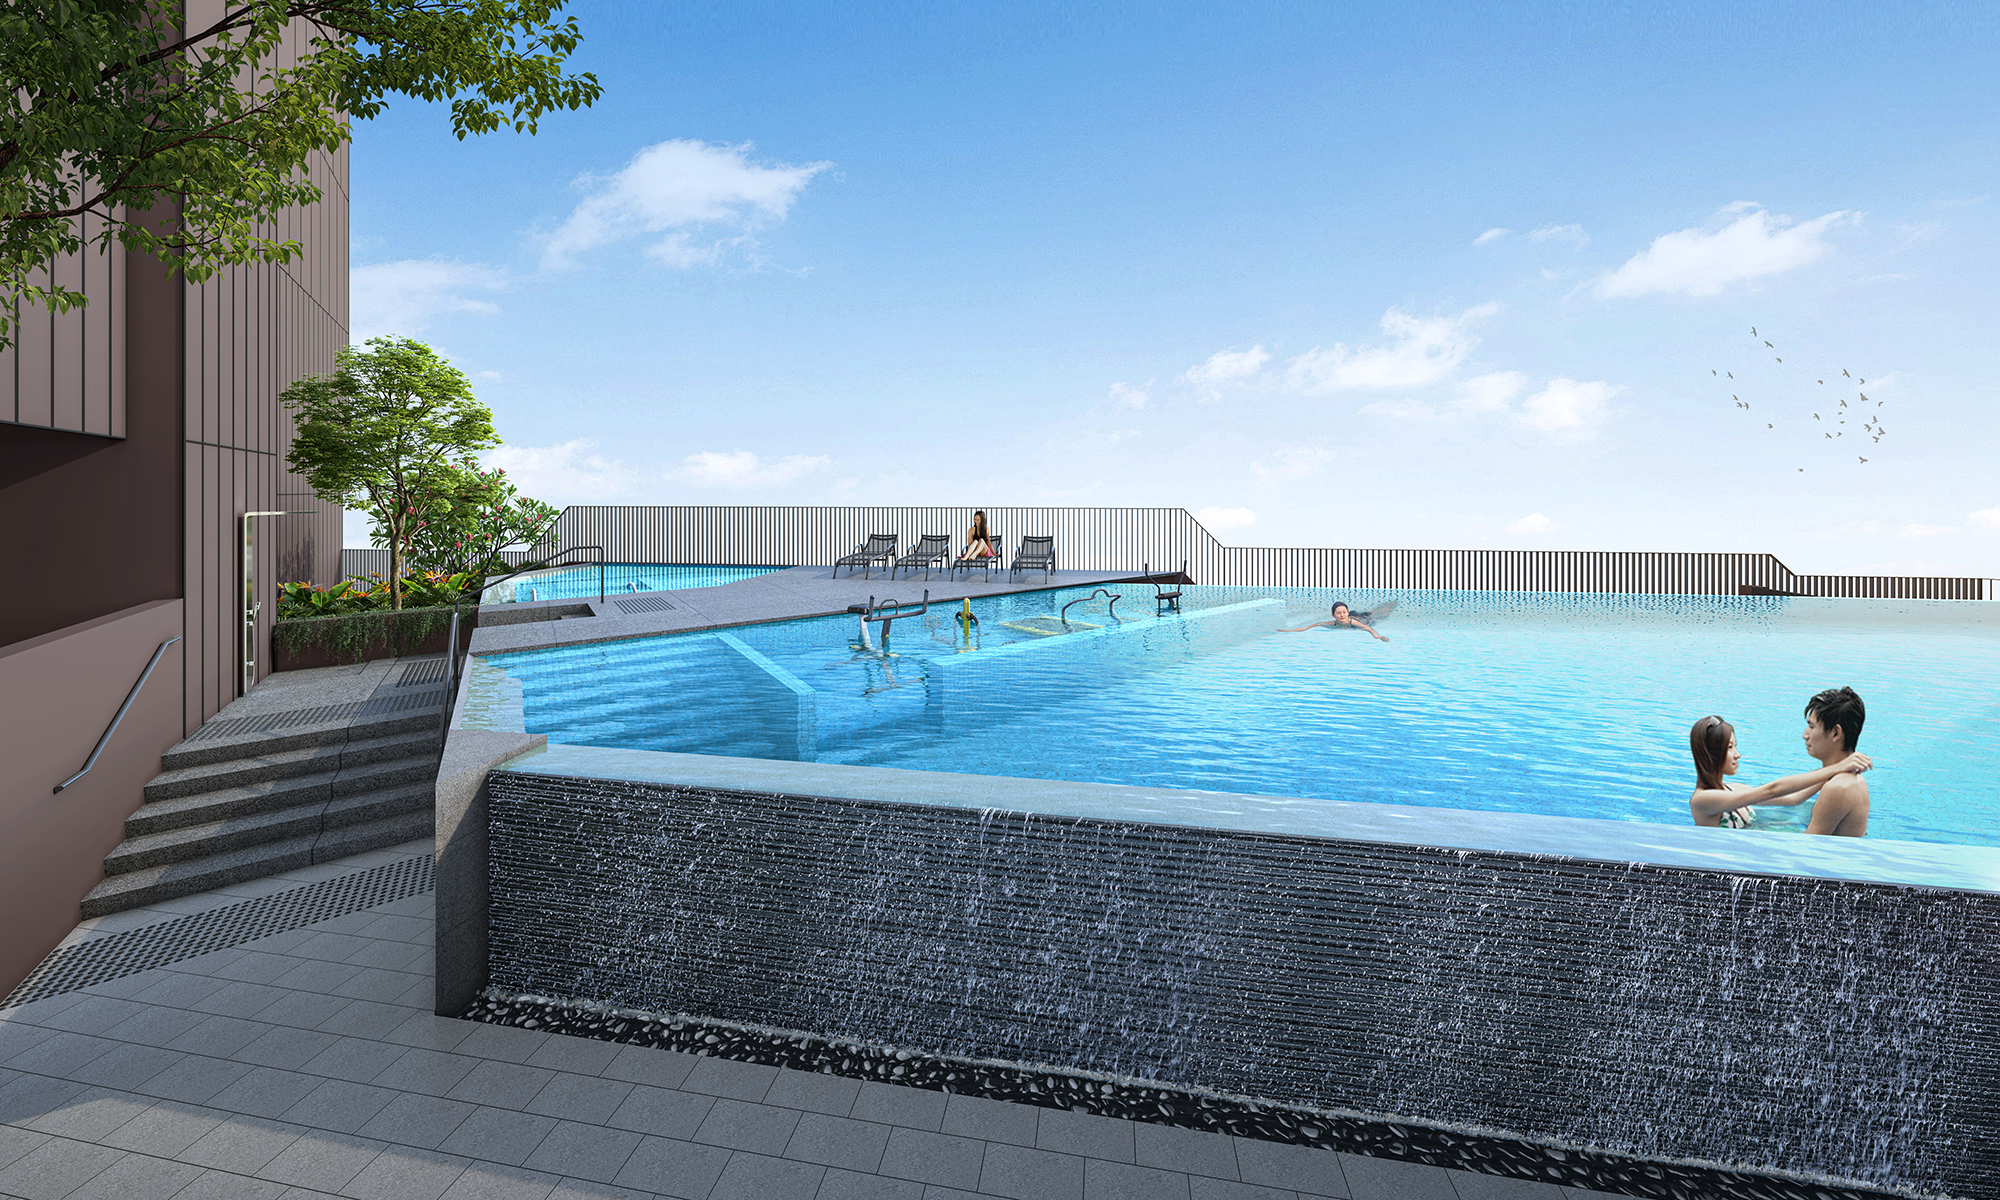
Facilities: Rooftop infinity pool, artist's impression. Arina East Residences project website (shows joint developers ZACD, FRX Capital, Welltech Construction) 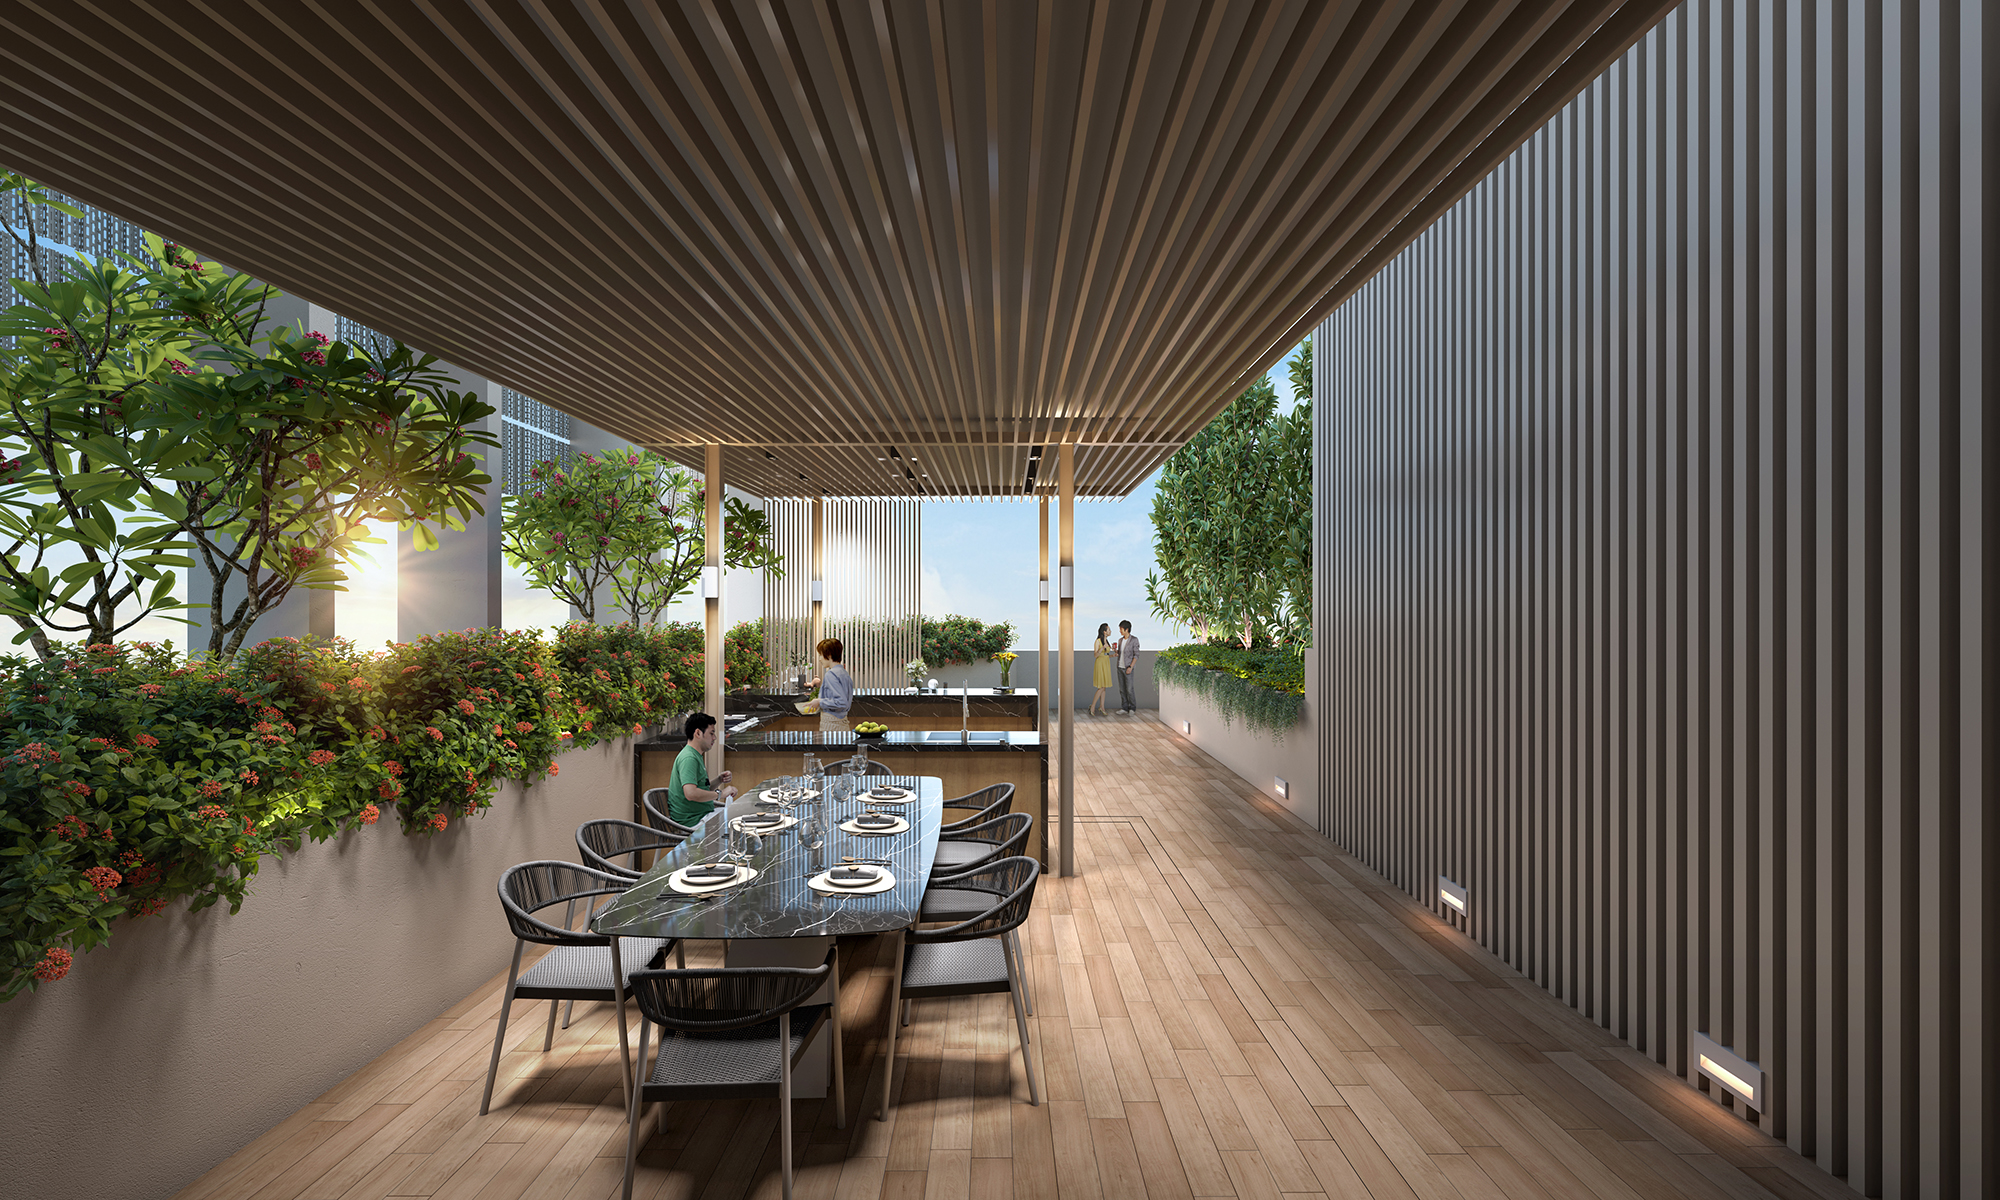
Facilities: Covered dining pavilion, artist's impression. Arina East Residences project website (shows joint developers ZACD, FRX Capital, Welltech Construction)
Images from the developer, usually artist's impressions. The finished project may differ.
Want to see how this project fits you? Rank the launches by your budget, size, area and MRT distance, then open it from the list.
- Ready ()
- 2027
- Nearest MRT or LRT
- 144 m · ~2 min walkcalculated
- so far
- 97 of 107 (90.7%)
- Recent sales, median
- S$2,772 psfcalculated
- , median
- S$1,939 psfcalculated
- Freehold
- Developer
- ZACD LV Development Pte Ltd
- Launched
- 7 Jun 2025
Nearest station in service: Katong Park MRT Station. Distances are straight-line; walking routes are longer.
Is it worth buying?
PropGPT financial score
74out of 100
Strong case on the numbers
Confidence: high, most figures known (100% of the weight known)
Adds up the measurable lines below: price against comparable homes, rental yield, the lease, how nearby prices moved, MRT distance and competing supply. 65 or more is a strong case on the numbers, 45 to 64 fair, under 45 weak. It leaves out what only you can judge (layout, school, the view) and is not a valuation or advice.
What makes up the scoreHide what makes up the score
| Part | Mark | Why |
|---|---|---|
| Price vs similar homes nearby19% of the scoreCosts 10% more than similar older homes nearby; usually 17% more. | 86 | Costs 10% more than similar older homes nearby; usually 17% more. |
| Rental yield vs typical14% of the scoreRent of about 2.2% of the price a year; typical is 2.4%. | 39 | Rent of about 2.2% of the price a year; typical is 2.4%. |
| Price vs other new launches nearby10% of the scoreCosts 11% less than other new launches nearby. | 100 | Costs 11% less than other new launches nearby. |
| Price vs launches in the region10% of the score3% below the typical price of launches in the region. | 61 | 3% below the typical price of launches in the region. |
| Price vs the developer's likely breakeven10% of the scorePriced at 1.29 times the developer's likely cost. | 41 | Priced at 1.29 times the developer's likely cost. |
| Value lost to the lease in the next 10 years10% of the scoreFreehold or 999-year: no lease running down. | 100 | Freehold or 999-year: no lease running down. |
| Nearby homes that beat the market10% of the score11 of 17 nearby projects beat the market. | 75 | 11 of 17 nearby projects beat the market. |
| Distance to the MRT10% of the score144 m to the nearest station. | 100 | 144 m to the nearest station. |
| Competing homes finishing nearby5% of the score226 competing homes finishing nearby around the same time. | 89 | 226 competing homes finishing nearby around the same time. |
| Developer's track record5% of the scoreNo problems reported, but few completed projects. | 50 | No problems reported, but few completed projects. |
What a property agent would weigh up, from public data. Each line gives a plain answer and what it means for you. Open “Show the calculation” on any line for the exact figures.
PropGPT compares private condos and apartments only (ECs with ECs). HDB flats and landed homes are never in these comparisons, and every price is a real sale recorded by URA, not an asking price.
In your favour 5Neutral 5Watch out 0Not known yet 0
Am I paying a fair price?
Price vs similar resale homes nearby · In your favour
Costs about 10% more than similar older homes nearby
New launches usually cost about 17% more than the older homes around them (the middle figure of the 64 launches selling now). This one's extra is smaller than usual, so less of your price is a new-home premium.
- This launch
- S$2,772 psf
- Usual for a launch here
- S$2,955 psf
- Similar homes nearby
- S$2,516 psf
Based on 197 resales, Nov 2025 to Nov 2026 · a rough guide only
Show the calculationHide the calculation
What it compares
This project's median price per sq ft (its own new sales in the last 12 months) against resale condos and apartments within 1.5 km, sold Nov 2025 to Nov 2026, 396–1,667 sq ft (this project's sizes, widened 20% each way). Each resale price is scaled to this project's lease, and to its building age (a new building, expected TOP 2027) where the resale's completion year is known. Not included: HDB flats, landed homes, homes resold before completion (sub-sales), and this project itself.The figures
- This project: S$2,772 psf, the median of its own new sales in the last 12 months.
- Nearby resale: S$2,516 psf, the median of 197 sales after the lease adjustment.
- Lease adjustment, for example: a freehold resale at S$2,000 psf counts as about S$1,920 against a new 99-year lease (96% of freehold); a 99-year resale with 70 years left at S$1,500 psf counts as about S$1,646.
- Age adjustment: 193 of 197 nearby sales are also scaled to this project's age (a new building, expected TOP 2027), about 0.9% per year of difference. For example, a resale in a building 10 years older at S$1,500 psf counts as about S$1,648. The other 4 have no known completion year and are not age-adjusted.
- Gap: S$2,772 psf ÷ S$2,516 psf − 1 = +10%. Usual gap (the middle of 64 launches selling now): +17%. In your favour when this gap is 5 percentage points or more below the usual gap; watch out when 5 or more above.
How fair is this comparison?
A rough guide only. Older homes against a new launch. Lease and size range are matched, building age is adjusted at an average rate; the premium for a brand-new home, condition, floor and facilities are not. That is why the line compares the gap with the usual gap for launches rather than with zero.What this check cannot see
- Building age is adjusted at one average rate, about 0.9% a year (measured from 10,793 private resales in 1,531 condos, Oct 2025 to Oct 2026). Real prices fall faster in a building's first 15 years and slower after, faster for 99-year leases than freehold, and upkeep differs between buildings.
- The lease adjustment uses the SLA leasehold table (Bala's Table), which values land, not the building; on very old leases it may over-adjust.
- Floor level, view, facing and unit mix are not adjusted. A project whose recent sales were mostly high floors looks dearer.
- 1.5 km in a straight line can reach across an expressway, river or park into a different market.
- URA gives one map point per project, so large projects are measured from a single spot.
Price vs other new launches nearby · In your favour
Costs about 11% less than other new launches within 1.5 km
You pay less than buyers of competing launches next door.
- This launch
- S$2,772 psf
- Other launches nearby
- S$3,120 psf
Based on 10 sales in other launches, Nov 2025 to Nov 2026
Show the calculationHide the calculation
What it compares
This project's median price per sq ft against new-launch sales in other projects within 1.5 km over the last 12 months, same size range (396–1,667 sq ft).The figures
- This project: S$2,772 psf
- Other launches nearby: S$3,120 psf median of 10 sales
- In your favour when 5% or more cheaper; watch out when 5% or more dearer.
How fair is this comparison?
Fair. New launches against new launches of similar sizes. Their land costs, finishes, facilities and launch dates differ, and a launch sells different floors at different stages.What this check cannot see
- Developer discounts and rebates are not in URA's caveat data, so real prices may be lower than recorded.
- 1.5 km in a straight line can reach across an expressway, river or park into a different market.
- A launch late in its sales has fewer cheap units left, so its median rises.
Price vs launches in this region · Neutral
About 3% below the typical price of other launches selling now in this region
Priced like most of the homes you are likely to compare it with.
- This launch
- S$2,772 psf
- Typical launch in the region
- S$2,868 psf
Based on 33 launches · a rough guide only
Show the calculationHide the calculation
What it compares
This project's price per sq ft against the median of other new launches selling now in the same URA region (Central, East, North, North-East or West).The figures
- This project: S$2,772 psf
- Median of 33 other launches selling now in this region: S$2,868 psf
- In your favour when 10% or more below the typical price; watch out when 10% or more above.
How fair is this comparison?
A rough guide only. Same region or type only: a region mixes places near and far from the city, and each launch's land cost differs.What this check cannot see
- Region medians mix very different locations: Orchard and Toa Payoh are both in the Central region.
- Unit sizes are not matched: small units cost more per sq ft, so a project of mostly small units looks dearer.
Land cost vs launch price · Neutral
Priced at about 1.29 times the developer's likely cost
A usual margin over what the project likely cost the developer.
- This launch
- S$2,772 psf
- Developer's likely cost
- S$2,156 psf
Based on the land price from PropGPT research, 22 Oct 2026
Show the calculationHide the calculation
What it compares
This project's price per sq ft against what the developer likely needs to break even: the land price per sq ft of allowed floor area (psf ppr) × 1.4.The figures
- Land: S$1,540 per sq ft of plot ratio, collective (en bloc) sale in 2021
- Likely breakeven: about S$2,156 psf (land × 1.4: land plus construction, financing and fees)
- This project: S$2,772 psf; S$2,772 psf ÷ S$2,156 psf = 1.29. In your favour under 1.15; watch out at 1.3 or more.
How fair is this comparison?
Fair. This project's own land and price; only the cost of building is estimated.What this check cannot see
- × 1.4 is a rule of thumb; consultants' estimates for a site differ, and construction costs rose sharply after 2021.
- The land price may or may not include a lease top-up or development charge; the research notes say which when known.
- Land bought years ago is cheaper in today's money, so older land makes the margin look bigger.
Sources
The Business Times: La Ville sold for S$152 million in third bid at collective sale, retrieved 2026-10-22
Can it earn or hold its value?
Rental yield · Neutral
About 2.2% of the price a year in rent, before costs
Close to the typical 2.4% for launches selling now.
- This launch
- 2.2%
- Typical for launches selling now
- 2.4%
Based on 1,699 rental contracts, Q1 2026 to Q3 2026
Show the calculationHide the calculation
What it compares
Rents of condos and apartments of similar size within 1.5 km (URA rental contracts, last 4 quarters), per sq ft, × 12, against this project's price per sq ft.The figures
- Nearby rent: S$5.12 per sq ft a month, median of 1,699 contracts (URA, Q1 2026 to Q3 2026)
- Yield = S$5.12 × 12 ÷ S$2,772 psf = 2.2%. In your favour when 0.3 percentage points or more above the typical yield; watch out when 0.3 or more below.
How fair is this comparison?
Fair. Rents of similar homes nearby, not of this project, which is not finished yet.What this check cannot see
- Gross yield: property tax, maintenance fees, agent fees and empty months usually take 1 to 2 percentage points off.
- URA records rented sizes as ranges (for example 900–1,000 sq ft); PropGPT uses the middle.
- New homes usually rent for more than the older homes nearby, so this may understate.
Lease · In your favour
Freehold
No lease runs down, so the home does not lose value as the years pass. Buyers usually pay more for this.
Based on URA's title record
Show the calculationHide the calculation
What it compares
The title's tenure, as recorded by URA.How fair is this comparison?
Very fair. A fact about this home.What this check cannot see
- Freehold land does not protect the building: it still ages, and an en bloc sale needs most owners to agree.
How nearby homes' prices moved · In your favour
11 of 17 nearby projects rose faster than the whole market
Homes around here have done better than the market in recent years. Past results do not guarantee future ones.
Based on 17 nearby projects, sales from Oct 2021 · a rough guide only
Show the calculationHide the calculation
What it compares
For each project within 1.5 km with enough sales: the median price of its first 12 months of sales in PropGPT's data against its resales in the last 12 months, at least 2 years apart, compared with URA's private non-landed price index over the same quarters.The figures
- THE LINE @ TANJONG RHU (114 m): +3% from 2022-Q2 to 2026-Q2; market +21%
- RIVEREDGE (313 m): +21% from 2022-Q2 to 2026-Q1; market +21%
- THE WATERSIDE (352 m): +31% from 2022-Q2 to 2026-Q1; market +21%
- LIV @ MB (410 m): +10% from 2022-Q2 to 2026-Q2; market +21%
- THE SEAFRONT ON MEYER (472 m): +26% from 2022-Q1 to 2026-Q2; market +25%
- MEYER MANSION (814 m): +11% from 2022-Q2 to 2026-Q1; market +21%
- In your favour when 60% or more of nearby projects beat the market; watch out at 40% or fewer.
How fair is this comparison?
A rough guide only. Each project against itself over time, so like for like within a project; but the projects are not this one.What this check cannot see
- PropGPT's sales data starts in October 2021, so an older project's 'first year' is a resale year, not its launch.
- A project's early sales may be small units and later ones large, or the other way round.
- Past price moves do not predict future ones.
MRT · In your favour
144 m to Katong Park MRT Station
Within an easy walk; homes near stations are in steady demand from buyers and tenants.
Based on LTA station exits and URA Master Plan 2019, worked out 4 Nov 2026
Show the calculationHide the calculation
What it compares
Straight-line distance from the project's map point to the nearest MRT or LRT exit in service (LTA), and to the nearest planned station (URA Master Plan 2019).The figures
- Nearest planned station: Founders Memorial (planned), 1,967 m
- In your favour within 500 m of a station in service or planned; watch out over 1 km from both.
How fair is this comparison?
Very fair. A fact about this location.What this check cannot see
- Straight-line distance: walking routes are longer, often by a third.
- Planned stations can be years away and dates change.
What could go wrong?
Competing homes finishing nearby · Neutral
226 homes in 1 other project within 1.5 km due 2025–2029
Some competing new homes nearby, fewer than 1,000.
Based on URA's list of projects not yet completed, worked out 4 Nov 2026
Show the calculationHide the calculation
What it compares
Homes in other private projects within 1.5 km that URA lists as not yet completed, due within 2 years of this project's completion (TOP).The figures
- URA pipeline of private homes not yet completed.
- In your favour when there are none; watch out at 1,000 homes or more.
How fair is this comparison?
Fair. Counts homes, not who will sell or rent them.What this check cannot see
- Completion years in URA's pipeline often shift by a year or more.
- Land sold but not yet in URA's pipeline is not counted.
- 1.5 km in a straight line can reach across an expressway, river or park into a different market.
Developer's track record · Neutral
no problems found in the news
No problems found in the news, but few completed projects to judge by.
Show the calculationHide the calculation
What it compares
Housing projects the developer has completed in Singapore, and delays, defects or disputes reported in established news in the last 10 years (PropGPT research).How fair is this comparison?
Fair. The developer's other projects, not this one.What this check cannot see
- Only problems reported in the news are found; many defects are settled quietly.
- Joint ventures: a problem of one partner is listed even when the other partner led the project.
Cost to buy, hold and sell · Fact
S$41,800 in stamp duty for the cheapest unit
Profit only starts after these costs are covered.
Based on today's IRAS stamp duty rates
Show the calculationHide the calculation
What it compares
Stamp duties under the current IRAS rates for the price shown.The figures
- Stamp duty on S$1.43M: S$41,800 (assumes a Singapore citizen buying a first home)
- Selling within 4 years of buying costs seller's stamp duty of 16% falling to 4%; buying now, that ends around Nov 2030.
- Interest is paid only on the loan drawn so far; payments rise as the building goes up.
How fair is this comparison?
Very fair. Worked out for this price.What this check cannot see
- Assumes a Singapore citizen buying a first home until you add your details.
Good to know (not judged)
Sales so far · Fact
90.7% sold in 17 months
Fast sales show interest, but projects that sold fast have later made losses and slow sellers have made gains. Not a sign of profit.
Project size · Fact
107 homes
Big projects have more facilities but more owners selling against you at the same time.
Government land sales and big developments nearby · Fact
1 planned within about 2 km
New land sales add competing homes; new stations, malls and offices add demand. Both are public, so prices may already include them.
Based on PropGPT research, 22 Oct 2026
Show the calculationHide the calculation
The figures
- Tanjong Rhu GLS site, about 520 homes planned, drew a top bid of S$1,455 psf ppr from CDL and Woh Hup in February 2026
Sources
The Business Times: CDL, Woh Hup tie-up tops Tanjong Rhu site tender at S$1,455 psf ppr, retrieved 2026-10-22Growth-area plans · Fact
Not in a named growth area, as far as PropGPT found
Growth areas are planned for decades and are public, so prices often include them already.
PropGPT calculations from URA and data.gov.sg, updated 3 Nov 2026. PropGPT is not a licensed estate agency and does not act for buyers or sellers. These figures are not a valuation, a forecast or financial advice, and past results nearby do not predict future returns. How each line is worked out
What you would pay
For the cheapest 1BR at S$1,430,000. Estimates, not financial advice.
- Monthly loan payment
- S$4,522
- Cash and CPF needed upfront
- S$402,300at least S$71,500 of it in cash
- S$41,800
- S$0
PropGPT calculation: at 3.0% over 30 years; upfront = price − loan + stamp duties + about S$3,000 legal fees. Banks require at least 5% of the price in cash; the rest can come from CPF. Stamp duty assumes a Singapore citizen buying a first home. Add your details for your own figures. You can change the loan assumptions in Compare.
Unit types and prices
As published by the developer or reported in the press. Availability changes daily; confirm with the developer.
1BRfrom S$1,430,000
495 sq ftS$2,889 psf
2BR Deluxefrom S$1,950,000
678 sq ftS$2,876 psf
2BR Premiumnot published
797 sq ftnot published psf
3BR Deluxefrom S$2,860,000
969 sq ftS$2,951 psf
4BR Premium (Private Lift)from S$4,340,000
1,389 sq ftS$3,125 psf
| Type | Size (sq ft) | Price | |
|---|---|---|---|
| 1BR | 495 | from S$1,430,000 | S$2,889 |
| 2BR Deluxe | 678 | from S$1,950,000 | S$2,876 |
| 2BR Premium | 797 | Not published | Not published |
| 3BR Deluxe | 969 | from S$2,860,000 | S$2,951 |
| 4BR Premium (Private Lift) | 1,389 | from S$4,340,000 | S$3,125 |
Price per square foot of actual sales, by month
URA caveats lodged for new sales; median per month calculated by PropGPT. Months with no sales are left out.
Nearby homes and what they sold for
Private condos and apartments within 1.5 km sold in the last 12 months (URA). Use this to judge whether the price is high or low for the area.
10 nearby projects, median from S$1,890 to S$2,810. Show the listHide the list
| Project | Distance | Tenure | Median PSF | Typical size | Sales |
|---|---|---|---|---|---|
| DE CENTURION | 72 m | Freehold | S$2,047 | 910 sq ft | 2 |
| CRYSTAL RHU | 89 m | Freehold | S$2,151 | 1,270 sq ft | 3 |
| FULCRUM | 102 m | Freehold | S$2,231 | 748 sq ft | 4 |
| THE LINE @ TANJONG RHU | 114 m | Freehold | S$2,359 | 1,050 sq ft | 8 |
| ONE FORT | 128 m | Freehold | S$2,100 | 1,238 sq ft | 1 |
| MEYER RESIDENCE | 227 m | Freehold | S$2,235 | 1,152 sq ft | 2 |
| ONE MEYER | 243 m | Freehold | S$2,810 | 824 sq ft | 4 |
| THE MEYER PLACE | 284 m | Freehold | S$2,062 | 1,410 sq ft | 2 |
| RIVEREDGE | 313 m | 99-year from 2004 | S$1,890 | 1,410 sq ft | 6 |
| THE VIEW @ MEYER | 329 m | Freehold | S$2,366 | 1,690 sq ft | 4 |
Location
- Nearest MRT station
- Katong Park MRT Station
- 144 m · ~2 min walk
- Nearest school
- Dunman High School
- 166 m · ~3 min walk
- Nearest park
- Katong Pk
- 338 m · ~5 min walk
- Nearest supermarket
- Cold Storage Singapore (1983) Pte Ltd (Leisure Park)
- 930 m · ~12 min walk
Open data from LTA, NParks, MOE and SFA (data.gov.sg), located with OneMap. Malls are not shown: no open dataset exists. Map: OpenFreeMap, OpenStreetMap contributors.
What next?
Add Arina East Residences to Compare and put it next to two or three others, or go back to all launches. Before you commit, visit the showflat and confirm prices with the developer.