Lentor Gardens Residences
, Ang Mo Kio, North-East · 99-year leasehold · Launched
Lentor Gardens Residences comprises 499 condominium units in three 16-storey blocks and one 8-storey block, plus three strata-titled terrace houses, on a 99-year leasehold site in the Lentor Hills estate. It is the seventh private residential project launched in the estate.
- From
- Not published
- Lowest
- Not published

Exterior: Aerial view of the two towers and pool, artist's impression. Kingsford Group: Lentor Gardens Residences project page 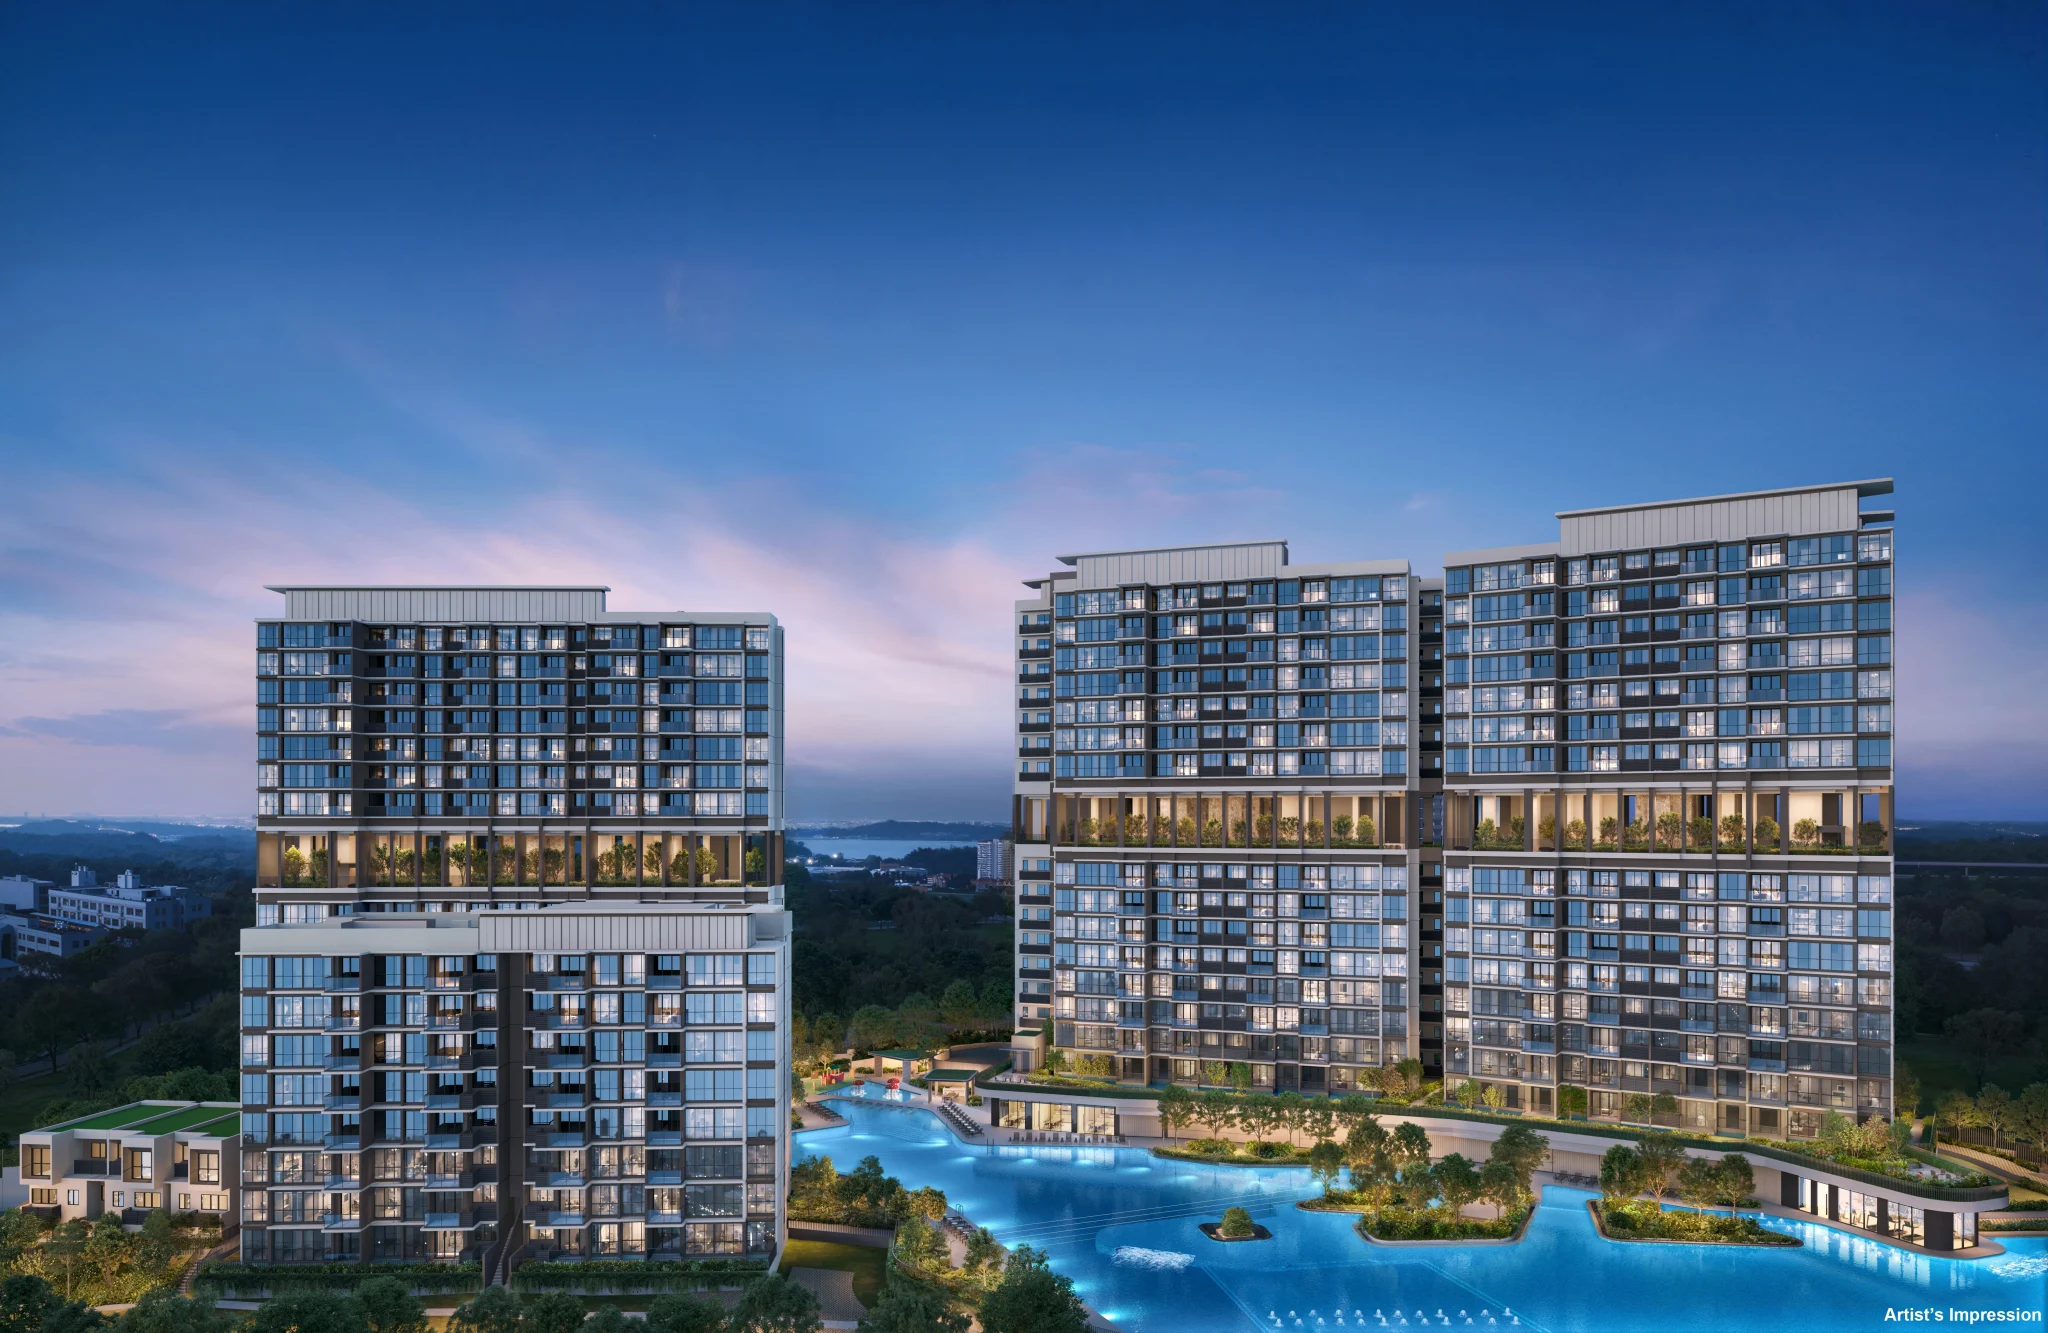
Exterior: Towers at dusk, artist's impression. Kingsford Group: Lentor Gardens Residences project page 
Interior: 2-bedroom show unit, living and dining area. Kingsford Group: Lentor Gardens Residences project page 
Interior: 4-bedroom show unit, master bedroom. Kingsford Group: Lentor Gardens Residences project page 
Facilities: Pool deck between the towers, brochure page, artist's impression. Kingsford Group: Lentor Gardens Residences project page 
Site plan: Site plan with facilities legend. Kingsford Group: Lentor Gardens Residences project page
Images from the developer, usually artist's impressions. The finished project may differ.
Want to see how this project fits you? Rank the launches by your budget, size, area and MRT distance, then open it from the list.
- Ready ()
- 2030
- Nearest MRT or LRT
- 411 m · ~6 min walkcalculated
- so far
- 304 of 499 (60.9%)
- Recent sales, median
- S$2,357 psfcalculated
- , median
- S$1,710 psfcalculated
- 99-year leasehold
- Developer
- Kingsford Lentor Project Pte Ltd
- Launched
- 18 Jul 2026
Nearest station in service: Lentor MRT Station. Distances are straight-line; walking routes are longer.
Is it worth buying?
PropGPT financial score
68out of 100
Strong case on the numbers
Confidence: high, most figures known (81% of the weight known)
Adds up the measurable lines below: price against comparable homes, rental yield, the lease, how nearby prices moved, MRT distance and competing supply. 65 or more is a strong case on the numbers, 45 to 64 fair, under 45 weak. It leaves out what only you can judge (layout, school, the view) and is not a valuation or advice.
What makes up the scoreHide what makes up the score
| Part | Mark | Why |
|---|---|---|
| Price vs similar homes nearby24% of the scoreCosts 8% more than similar older homes nearby; usually 17% more. | 95 | Costs 8% more than similar older homes nearby; usually 17% more. |
| Rental yield vs typical18% of the scoreRent of about 2.4% of the price a year; typical is 2.4%. | 57 | Rent of about 2.4% of the price a year; typical is 2.4%. |
| Price vs other new launches nearbynot countedNot known yet. | Not known | Not known yet. |
| Price vs launches in the regionnot countedNot known yet. | Not known | Not known yet. |
| Price vs the developer's likely breakeven12% of the scorePriced at 1.83 times the developer's likely cost. | 0 | Priced at 1.83 times the developer's likely cost. |
| Value lost to the lease in the next 10 years12% of the scoreAbout 98 years left: the lease takes about 2.0% off its value in the next 10 years. | 80 | About 98 years left: the lease takes about 2.0% off its value in the next 10 years. |
| Nearby homes that beat the market12% of the score5 of 7 nearby projects beat the market. | 86 | 5 of 7 nearby projects beat the market. |
| Distance to the MRT12% of the score411 m to the nearest station. | 88 | 411 m to the nearest station. |
| Competing homes finishing nearby6% of the scoreNo competing homes finishing nearby around the same time. | 100 | No competing homes finishing nearby around the same time. |
| Developer's track record6% of the scoreProblems reported in the news. | 0 | Problems reported in the news. |
What a property agent would weigh up, from public data. Each line gives a plain answer and what it means for you. Open “Show the calculation” on any line for the exact figures.
PropGPT compares private condos and apartments only (ECs with ECs). HDB flats and landed homes are never in these comparisons, and every price is a real sale recorded by URA, not an asking price.
In your favour 4Neutral 2Watch out 2Not known yet 3
Am I paying a fair price?
Price vs similar resale homes nearby · In your favour
Costs about 8% more than similar older homes nearby
New launches usually cost about 17% more than the older homes around them (the middle figure of the 64 launches selling now). This one's extra is smaller than usual, so less of your price is a new-home premium.
- This launch
- S$2,357 psf
- Usual for a launch here
- S$2,552 psf
- Similar homes nearby
- S$2,173 psf
Based on 82 resales, Nov 2025 to Nov 2026 · a rough guide only
Show the calculationHide the calculation
What it compares
This project's median price per sq ft (its own new sales in the last 12 months) against resale condos and apartments within 1.5 km, sold Nov 2025 to Nov 2026, 517–1,795 sq ft (this project's sizes, widened 20% each way). Each resale price is scaled to this project's lease, and to its building age (a new building, expected TOP 2030) where the resale's completion year is known. Not included: HDB flats, landed homes, homes resold before completion (sub-sales), and this project itself.The figures
- This project: S$2,357 psf, the median of its own new sales in the last 12 months.
- Nearby resale: S$2,173 psf, the median of 82 sales after the lease adjustment.
- Lease adjustment, for example: a freehold resale at S$2,000 psf counts as about S$1,920 against a new 99-year lease (96% of freehold); a 99-year resale with 70 years left at S$1,500 psf counts as about S$1,646.
- Age adjustment: 82 of 82 nearby sales are also scaled to this project's age (a new building, expected TOP 2030), about 0.9% per year of difference. For example, a resale in a building 10 years older at S$1,500 psf counts as about S$1,648.
- Gap: S$2,357 psf ÷ S$2,173 psf − 1 = +8%. Usual gap (the middle of 64 launches selling now): +17%. In your favour when this gap is 5 percentage points or more below the usual gap; watch out when 5 or more above.
How fair is this comparison?
A rough guide only. Older homes against a new launch. Lease and size range are matched, building age is adjusted at an average rate; the premium for a brand-new home, condition, floor and facilities are not. That is why the line compares the gap with the usual gap for launches rather than with zero.What this check cannot see
- Building age is adjusted at one average rate, about 0.9% a year (measured from 10,793 private resales in 1,531 condos, Oct 2025 to Oct 2026). Real prices fall faster in a building's first 15 years and slower after, faster for 99-year leases than freehold, and upkeep differs between buildings.
- The lease adjustment uses the SLA leasehold table (Bala's Table), which values land, not the building; on very old leases it may over-adjust.
- Floor level, view, facing and unit mix are not adjusted. A project whose recent sales were mostly high floors looks dearer.
- 1.5 km in a straight line can reach across an expressway, river or park into a different market.
- URA gives one map point per project, so large projects are measured from a single spot.
Price vs other new launches nearby · Not known yet
Not known yet
Fewer than 10 new-launch sales of similar size in other projects within 1.5 km in the last 12 months.
Show the calculationHide the calculation
What it compares
This project's median price per sq ft against new-launch sales in other projects within 1.5 km over the last 12 months, same size range (517–1,795 sq ft).Price vs launches in this region · Not known yet
Not known yet
Fewer than 5 others to compare with.
Show the calculationHide the calculation
What it compares
This project's price per sq ft against the median of other new launches selling now in the same URA region (Central, East, North, North-East or West).Land cost vs launch price · Watch out
Priced at about 1.83 times the developer's likely cost
Priced well above what the project likely cost the developer, so the developer has room to give discounts later. Do not rush.
- This launch
- S$2,357 psf
- Developer's likely cost
- S$1,288 psf
Based on the land price from PropGPT research, 22 Oct 2026
Show the calculationHide the calculation
What it compares
This project's price per sq ft against what the developer likely needs to break even: the land price per sq ft of allowed floor area (psf ppr) × 1.4.The figures
- Land: S$920 per sq ft of plot ratio, Government Land Sales tender in 2025
- Likely breakeven: about S$1,288 psf (land × 1.4: land plus construction, financing and fees)
- This project: S$2,357 psf; S$2,357 psf ÷ S$1,288 psf = 1.83. In your favour under 1.15; watch out at 1.3 or more.
How fair is this comparison?
Fair. This project's own land and price; only the cost of building is estimated.What this check cannot see
- × 1.4 is a rule of thumb; consultants' estimates for a site differ, and construction costs rose sharply after 2021.
- The land price may or may not include a lease top-up or development charge; the research notes say which when known.
- Land bought years ago is cheaper in today's money, so older land makes the margin look bigger.
Sources
Can it earn or hold its value?
Rental yield · Neutral
About 2.4% of the price a year in rent, before costs
Close to the typical 2.4% for launches selling now.
- This launch
- 2.4%
- Typical for launches selling now
- 2.4%
Based on 508 rental contracts, Q1 2026 to Q3 2026
Show the calculationHide the calculation
What it compares
Rents of condos and apartments of similar size within 1.5 km (URA rental contracts, last 4 quarters), per sq ft, × 12, against this project's price per sq ft.The figures
- Nearby rent: S$4.78 per sq ft a month, median of 508 contracts (URA, Q1 2026 to Q3 2026)
- Yield = S$4.78 × 12 ÷ S$2,357 psf = 2.4%. In your favour when 0.3 percentage points or more above the typical yield; watch out when 0.3 or more below.
How fair is this comparison?
Fair. Rents of similar homes nearby, not of this project, which is not finished yet.What this check cannot see
- Gross yield: property tax, maintenance fees, agent fees and empty months usually take 1 to 2 percentage points off.
- URA records rented sizes as ranges (for example 900–1,000 sq ft); PropGPT uses the middle.
- New homes usually rent for more than the older homes nearby, so this may understate.
Lease · Neutral
99-year leasehold
A lease loses value slowly at first, then faster: about 96% of a freehold home's value when new, 91% with 80 years left, 80% with 60 years left.
Based on URA's title record
Show the calculationHide the calculation
What it compares
The title's tenure, as recorded by URA.The figures
- SLA leasehold table (Bala's Table).
How fair is this comparison?
Very fair. A fact about this home.What this check cannot see
- Bala's Table describes land value; what buyers pay for old leases does not follow it exactly.
How nearby homes' prices moved · In your favour
5 of 7 nearby projects rose faster than the whole market
Homes around here have done better than the market in recent years. Past results do not guarantee future ones.
Based on 7 nearby projects, sales from Oct 2021 · a rough guide only
Show the calculationHide the calculation
What it compares
For each project within 1.5 km with enough sales: the median price of its first 12 months of sales in PropGPT's data against its resales in the last 12 months, at least 2 years apart, compared with URA's private non-landed price index over the same quarters.The figures
- LENTOR MODERN (331 m): +14% from 2022-Q3 to 2026-Q2; market +16%
- THE CALROSE (587 m): +33% from 2022-Q1 to 2026-Q2; market +25%
- MEADOWS @ PEIRCE (606 m): +22% from 2022-Q2 to 2026-Q2; market +21%
- SEASONS PARK (838 m): +30% from 2022-Q2 to 2026-Q2; market +21%
- BULLION PARK (954 m): +16% from 2022-Q1 to 2026-Q1; market +26%
- CASTLE GREEN (974 m): +33% from 2022-Q2 to 2026-Q1; market +21%
- In your favour when 60% or more of nearby projects beat the market; watch out at 40% or fewer.
How fair is this comparison?
A rough guide only. Each project against itself over time, so like for like within a project; but the projects are not this one.What this check cannot see
- PropGPT's sales data starts in October 2021, so an older project's 'first year' is a resale year, not its launch.
- A project's early sales may be small units and later ones large, or the other way round.
- Past price moves do not predict future ones.
MRT · In your favour
411 m to Lentor MRT Station
Within an easy walk; homes near stations are in steady demand from buyers and tenants.
Based on LTA station exits and URA Master Plan 2019, worked out 2 Nov 2026
Show the calculationHide the calculation
What it compares
Straight-line distance from the project's map point to the nearest MRT or LRT exit in service (LTA), and to the nearest planned station (URA Master Plan 2019).The figures
- Nearest planned station: Teck Ghee (planned), 2,485 m
- In your favour within 500 m of a station in service or planned; watch out over 1 km from both.
How fair is this comparison?
Very fair. A fact about this location.What this check cannot see
- Straight-line distance: walking routes are longer, often by a third.
- Planned stations can be years away and dates change.
What could go wrong?
Competing homes finishing nearby · In your favour
No other unfinished projects within 1.5 km due around the same time
No competition from other new homes when you want to rent out or sell.
Based on URA's list of projects not yet completed, worked out 2 Nov 2026
Show the calculationHide the calculation
What it compares
Homes in other private projects within 1.5 km that URA lists as not yet completed, due within 2 years of this project's completion (TOP).The figures
- URA pipeline of private homes not yet completed.
- In your favour when there are none; watch out at 1,000 homes or more.
How fair is this comparison?
Fair. Counts homes, not who will sell or rent them.What this check cannot see
- Completion years in URA's pipeline often shift by a year or more.
- Land sold but not yet in URA's pipeline is not counted.
- 1.5 km in a straight line can reach across an expressway, river or park into a different market.
Developer's track record · Watch out
2 problems reported in the news
Read what was reported and ask the developer how it was resolved.
Based on PropGPT research, 22 Oct 2026
Show the calculationHide the calculation
What it compares
Housing projects the developer has completed in Singapore, and delays, defects or disputes reported in established news in the last 10 years (PropGPT research).The figures
- 2019: The Controller of Housing issued a no-sale licence for Kingsford Huray's Normanton Park project after BCA found building works at its Kingsford Waterbay project deviated from requirements
- 2017: Kingsford Waterbay was issued an order to stop building works in December 2017, lifted after rectification works were completed
How fair is this comparison?
Fair. The developer's other projects, not this one.What this check cannot see
- Only problems reported in the news are found; many defects are settled quietly.
- Joint ventures: a problem of one partner is listed even when the other partner led the project.
Sources
Cost to buy, hold and sell · Not known yet
Not known yet
No price is published yet.
Good to know (not judged)
Sales so far · Fact
60.9% sold in 4 months
Fast sales show interest, but projects that sold fast have later made losses and slow sellers have made gains. Not a sign of profit.
Project size · Fact
499 homes
Big projects have more facilities but more owners selling against you at the same time.
Government land sales and big developments nearby · Fact
5 planned within about 2 km
New land sales add competing homes; new stations, malls and offices add demand. Both are public, so prices may already include them.
Based on PropGPT research, 22 Oct 2026
Show the calculationHide the calculation
The figures
- Lentor Central Residences on the adjacent Lentor Central plot, 477 homes, site sold at S$982 psf ppr in September 2023
- Hillock Green, 474 homes, launched November 2023
- Lentor Modern, 605 homes, launched September 2022
- Lentor Hills Residences, 498 homes, marketed from July 2023
- Lentor Central site near Lentor MRT station, about 560 homes, top bid S$1,278 psf ppr in March 2026
Sources
The Business Times: Hong Leong-led group to launch Lentor Central Residences (Feb 2025), retrieved 2026-10-22; The Business Times: Hesitant steps in a quiet place (Nov 2023), retrieved 2026-10-22; The Business Times: GuocoLand-led group tops Lentor Central site tender with S$1,278 psf ppr bid (Mar 2026), retrieved 2026-10-22Growth-area plans · Fact
Not in a named growth area, as far as PropGPT found
Growth areas are planned for decades and are public, so prices often include them already.
PropGPT calculations from URA and data.gov.sg, updated 2 Nov 2026. PropGPT is not a licensed estate agency and does not act for buyers or sellers. These figures are not a valuation, a forecast or financial advice, and past results nearby do not predict future returns. How each line is worked out
What you would pay
The developer has not published prices yet, so PropGPT cannot estimate costs for this project.
Unit types and prices
As published by the developer or reported in the press. Availability changes daily; confirm with the developer.
2BRnot published
646 to 732 sq ftnot published psf
3BRnot published
872 to 1,012 sq ftnot published psf
4BRnot published
1,184 to 1,356 sq ftnot published psf
5BR Strata Terracenot published
1,496 sq ftnot published psf
| Type | Size (sq ft) | Price | |
|---|---|---|---|
| 2BR | 646 to 732 | Not published | Not published |
| 3BR | 872 to 1,012 | Not published | Not published |
| 4BR | 1,184 to 1,356 | Not published | Not published |
| 5BR Strata Terrace | 1,496 | Not published | Not published |
Price per square foot of actual sales, by month
URA caveats lodged for new sales; median per month calculated by PropGPT. Months with no sales are left out.
Nearby homes and what they sold for
Private condos and apartments within 1.5 km sold in the last 12 months (URA). Use this to judge whether the price is high or low for the area.
10 nearby projects, median from S$1,062 to S$2,404. Show the listHide the list
| Project | Distance | Tenure | Median PSF | Typical size | Sales |
|---|---|---|---|---|---|
| LENTOR MODERN | 331 m | 99-year from 2021 | S$2,404 | 980 sq ft | 61 |
| THOMSON GROVE | 447 m | Freehold | S$1,444 | 2,895 sq ft | 3 |
| THE CALROSE | 587 m | Freehold | S$2,029 | 1,442 sq ft | 9 |
| MEADOWS @ PEIRCE | 606 m | Freehold | S$1,703 | 1,496 sq ft | 16 |
| SEASONS PARK | 838 m | 99-year from 1995 | S$1,317 | 1,088 sq ft | 12 |
| FAR HORIZON GARDENS | 846 m | 99-year from 1982 | S$1,062 | 1,620 sq ft | 4 |
| BULLION PARK | 954 m | Freehold | S$1,535 | 1,238 sq ft | 5 |
| CASTLE GREEN | 974 m | 99-year from 1993 | S$1,385 | 1,050 sq ft | 14 |
| THE PANORAMA | 1,065 m | 99-year from 2013 | S$2,090 | 1,012 sq ft | 32 |
| LATTICE ONE | 1,411 m | Freehold | S$1,800 | 861 sq ft | 1 |
Location
- Nearest MRT station
- Lentor MRT Station
- 411 m · ~6 min walk
- Nearest school
- Anderson Primary School
- 1.1 km · ~14 min walk
- Nearest park
- Teacher'S Estate Park
- 140 m · ~2 min walk
- Nearest supermarket
- Cold Storage Singapore (1983) Pte Ltd (Sembawang Hills Estate)
- 1.3 km · ~17 min walk
Open data from LTA, NParks, MOE and SFA (data.gov.sg), located with OneMap. Malls are not shown: no open dataset exists. Map: OpenFreeMap, OpenStreetMap contributors.
What next?
Add Lentor Gardens Residences to Compare and put it next to two or three others, or go back to all launches. Before you commit, visit the showflat and confirm prices with the developer.